This is sort of an Excel question.
Here is Census data on household income for Portland OR. Mean income has risen about 5%/yr from 2011-2018.
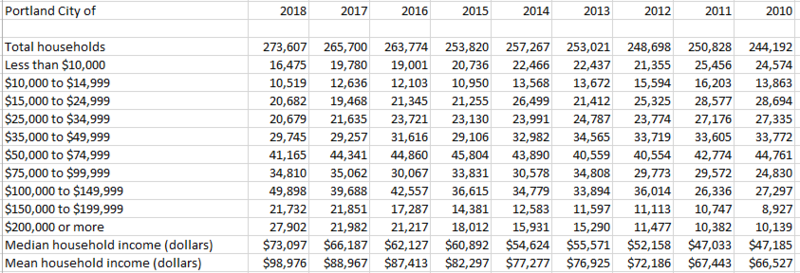
I am trying to see if the gain in mean income, and the decrease [increase] in the number of low [high] income households, is due to broad across the board income gains, or to high income households migrating in and low income households migrating out.
It occurred to me that one way to test this would be to 1) build an assumed model for the 2010 household income distribution in some detail (X households with $0-1K income, Y households with $1-2K income, all the way to ZZ households with $200K+ income), 2) adjust that model to match the reported 2010 household counts by income ranges and the 2010 mean and median income, then 3) start testing different scenarios. For example, grow every household's income by 5%/yr and assume net in-migration was of the same income distribution as existing households, and see if the resulting modeled population and household distribution match the reported 2018 data. If yes, then it is plausible that incomes did grow broadly across the board. If not, start testing other scenarios to see which might result in the model matching the 2018 data.
Does this make any sense at all? It'll be a lot of work.