|
|
|
|
|
| Author |
|
|
Registered

|
Is this seasonally adjusted? Not surprising to see many spending categories rise seasonally in December. "Gifts", for instance. Christmas and all that.
Quote:
__________________
1989 3.2 Carrera coupe; 1988 Westy Vanagon, Zetec; 1986 E28 M30; 1994 W124; 2004 S211 What? Uh . . . he and him? |
||
 01-30-2009, 05:44 PM
|
|
|
Bandwidth AbUser
Join Date: Nov 2001
Location: SoCal
Posts: 29,522
|
agreed. it made sense to me.
__________________
Jim R. |
||
|
01-30-2009, 05:48 PM
|
|
|
Registered

Join Date: Jun 2005
Location: Hamburg & Vancouver
Posts: 7,693
|
Quote:
I am holding a boat-load of Deutsche Bank shares. This chart makes me want to weep!
__________________
_____________________ These are my principles. If you don't like them, I have others.Groucho Marx |
||
|
01-30-2009, 05:57 PM
|
|
|
Registered

Join Date: Feb 2004
Location: Granite Bay, CA
Posts: 767
|
Quote from Dr. Doom to go along with the Bank Capitalization charts:
Professor Nouriel Roubini and his team have been noting in speeches in various venues around the world that they estimate that losses from the financial world could be as high as $3.6 trillion. That is composed of $1.6 trillion in loan losses and another $2 trillion in mark-to-market losses of securitized assets. "U.S. banks and broker dealers are estimated to incur about half of these losses, or $1.8 trillion ($1-1.1 trillion loan losses and $600-700bn in securities writedowns) as 40% of securitizations are assumed to be held abroad. The $1.8 trillion figure compares to banks and broker dealers capital of $1.4 trillion as of Q3 of 2008, leaving the banking system borderline insolvent even if writedowns on securitizations are excluded."
__________________
99 supercharged Boxster 1977 911 race car - gts (sold)  Spec 911 Racing Porsche Racing Club |
||
|
01-30-2009, 06:19 PM
|
|
|
Registered
Join Date: Feb 2004
Location: Granite Bay, CA
Posts: 767
|
From Joseph H.Ellis...Former Goldman Sachs Analyst
 The downtrend in year-over-year real hourly earnings (individuals purchasing power) in 20072008 once again provided some warning of the downtrend in consumer spending and a bear maket, although the magnitude of the recent market decline was far greater than normal due to the financial crisis. However, the recent upturn in growth of real wages (purchasing power) resulting from lower energy costs could be an early signal that real (unit) consumer spending will recover late in 2009. This would help begin a recovery in the economy in general and, of course, the stock market.
__________________
99 supercharged Boxster 1977 911 race car - gts (sold) Spec 911 Racing Porsche Racing Club Last edited by tc-sacto; 01-30-2009 at 06:39 PM.. |
||
|
01-30-2009, 06:31 PM
|
|
|
Registered

Join Date: Aug 2007
Location: The Golden State
Posts: 1,533
|
Quote:
__________________
Rod... 2010 - 997 PDK, Black on Black, Daily driver. 1987 - 930 Grand Prix White, Not looking for crazy HP, just harmony! |
||
|
01-30-2009, 07:52 PM
|
|

|
|
Registered
|
How do you get that info? I looked on the mint.com site but it wasn't obvious.
__________________
1989 3.2 Carrera coupe; 1988 Westy Vanagon, Zetec; 1986 E28 M30; 1994 W124; 2004 S211 What? Uh . . . he and him? |
||
|
01-30-2009, 08:20 PM
|
|
|
Registered

Join Date: Apr 2002
Location: Santa Clara, CA
Posts: 5,668
|
Quote:
The reader naturally compares the area of the circles. But the data numbers correspond to the diameter of the circles. If it had been presented in the typical candle chart format, the declines would have appeared far less severe, and would have been accurately portrayed. Intentionally misleading.
__________________
Chuck Moreland - elephantracing.com - vonnen.com |
||
|
01-30-2009, 08:23 PM
|
|
|
Registered
|
From shadowstats.com. Note the estimated M3 curve.
 From Census Bureau.  For everyone wondering why there's no inflation currently.
__________________
1989 3.2 Carrera coupe; 1988 Westy Vanagon, Zetec; 1986 E28 M30; 1994 W124; 2004 S211 What? Uh . . . he and him? |
||
|
01-30-2009, 08:31 PM
|
|
|
Registered
Join Date: Aug 2007
Location: The Golden State
Posts: 1,533
|
Quote:
http://www.techcrunch.com/2009/01/30/the-economy-according-to-mint/
__________________
Rod... 2010 - 997 PDK, Black on Black, Daily driver. 1987 - 930 Grand Prix White, Not looking for crazy HP, just harmony! |
||
|
01-30-2009, 09:04 PM
|
|
|
Registered
Join Date: Oct 2006
Location: Colorado, USA
Posts: 8,279
|
The Granddaddy of PPOT charts, the one that most people (including most here) somehow didn't think would ever go down, the one I was called "Chicken Little" more than once when posting it over the past few years and giving warnings about where it was going . . .
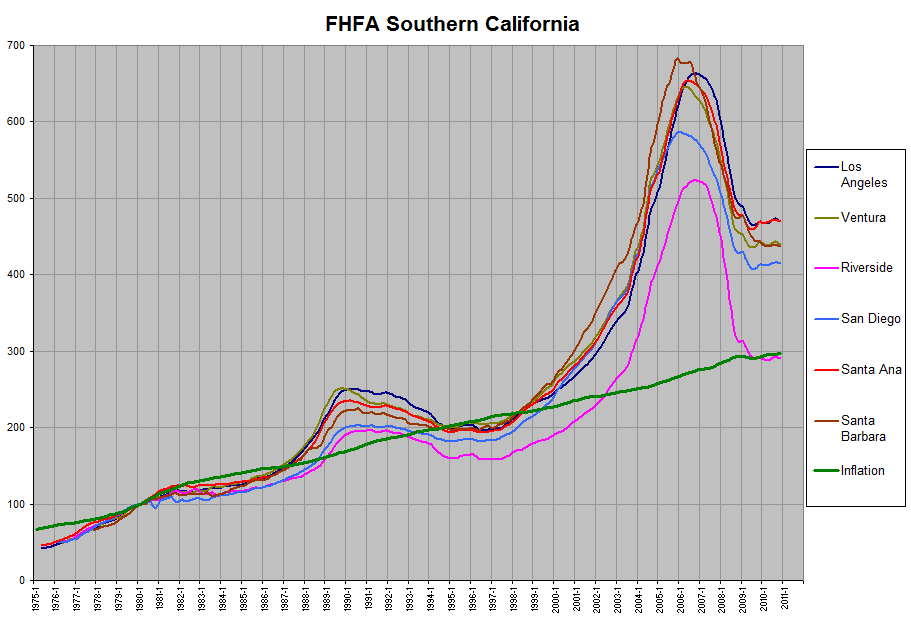 I STILL can't believe how many people, in 2006, when this chart was cresting and starting to turn down, said "It won't go significantly down" and "maybe there will be a 5% correction, but that's it." "This time is different" "Real estate never goes down" "California real estate is special because everyone wants to live there" "Dumb rich asians will always overpay and keep the values up" etc. etc. etc. Anyone who bought a house in Cal in 2005, 2006, 2007 was a fool, period. Last edited by the; 01-30-2009 at 10:53 PM.. |
||
|
01-30-2009, 10:49 PM
|
|
|
Registered
|
Quote:
Good catch!
__________________
Silver '88 RoW Carrera Grey '06 A4 Avant |
||
|
01-31-2009, 09:21 AM
|
|

|
|
Registered
Join Date: May 2000
Location: Los Alamos, NM, USA
Posts: 6,044
|
"Anyone who bought a house in Cal in 2005, 2006, 2007 was a fool, period."
Also a fool's buy in 2000-2004, 2008 and probably also 2009. I hope they have long snorkels for they're going to be underwater for a while. 
|
||
|
01-31-2009, 12:29 PM
|
|
|
Registered
Join Date: Jun 2005
Location: Hamburg & Vancouver
Posts: 7,693
|
Quote:
__________________
_____________________ These are my principles. If you don't like them, I have others.Groucho Marx |
||
|
01-31-2009, 05:28 PM
|
|
|
Registered
Join Date: May 2000
Location: Los Alamos, NM, USA
Posts: 6,044
|
"Not true if you flipped it for a profit." - and then stayed out of the real estate market instead of rolling it back in for their next "big score".
If they were that clairvoyant then they also probably made a bundle timing the stock market perfectly. ")
|
||
|
01-31-2009, 05:58 PM
|
|
|
Registered
Join Date: Jun 2005
Location: Hamburg & Vancouver
Posts: 7,693
|
Quote:
So not everyone was a fool. Simple point.
__________________
_____________________ These are my principles. If you don't like them, I have others.Groucho Marx |
||
|
01-31-2009, 06:02 PM
|
|
|
Registered
Join Date: May 2008
Posts: 1,144
|
Quote:
__________________
'87, Modified WUR, Billet valve, 965 downpipe, Kokeln intercooler, GHL headers, Garrett T04B K27 hybrid, Tial w/.8 bar, WEGO IV, RarlyL8 dual out, LSD |
||
|
01-31-2009, 06:17 PM
|
|
|
Registered

|
Quote:
I don't know what a candle chart is though. You mean bar graph? |
||
|
01-31-2009, 06:30 PM
|
|
|
Registered
Join Date: May 2000
Location: Los Alamos, NM, USA
Posts: 6,044
|
"Well let's face it, there are a lot of people who made a lot of money on the bubble.
So not everyone was a fool. Simple point." Its the money that one leaves "Vegas with" that counts. However if they did make a bunch of money in the end, while essentially adding nothing of value to the system, then I would propose a significant retroactive "excess profits like tax" be applied to their gains (any yearly gain over say 4%) so they can assist the rest of us who will be paying for the bubble they profited from. |
||
|
01-31-2009, 06:49 PM
|
|
|
Registered
Join Date: Apr 2002
Location: Santa Clara, CA
Posts: 5,668
|
Quote:
Yes, a bar chart. Candle chart specifically means vertical bars. If the intent was to relate the gravity of the situation, then the data would have been portrayed accurately. Instead the intent was to exaggerate the situation. It is technically correct but highly misleading, and obviously intentionally so. This is similar to the common trick of exaggerating differences by using a candle chart that doesn't start at zero. Technically correct, but misleading.
__________________
Chuck Moreland - elephantracing.com - vonnen.com |
||
|
01-31-2009, 07:08 PM
|
|


 1989 Porsche 911 Carrera 3.2


 1988 Porsche Carrera 3.2
 1979 Porsche 911SC 3.0
